Singapore’s private homes most expensive in Asia Pacific, says latest study

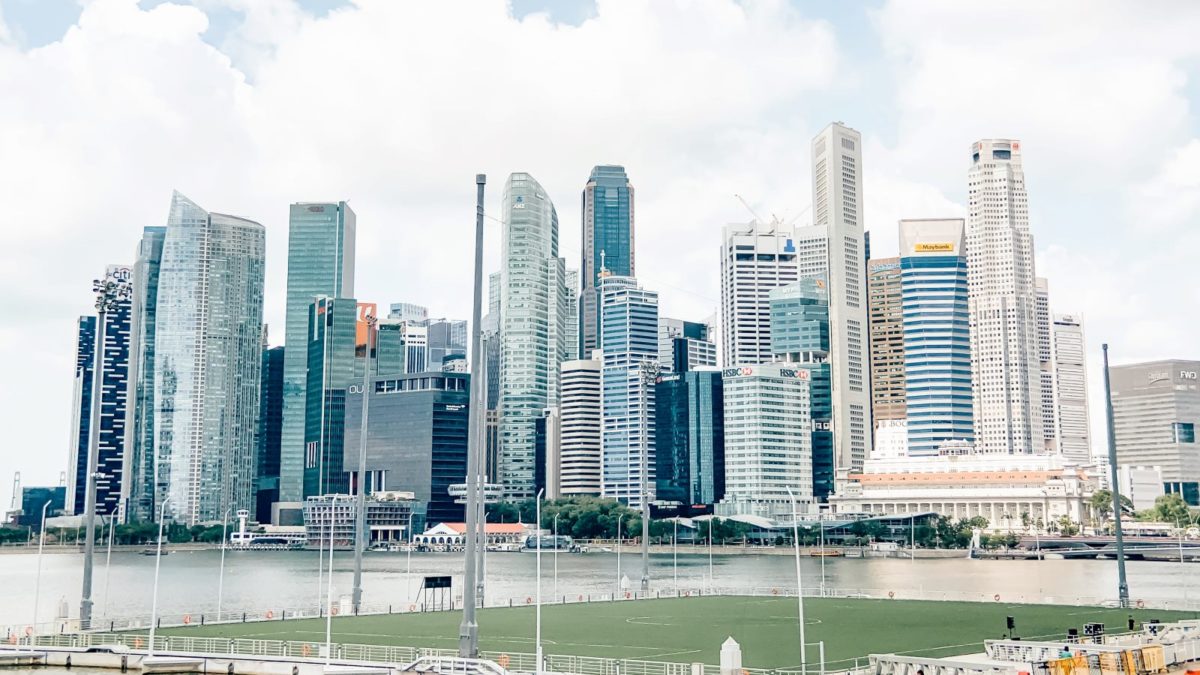
Singapore’s private-sector homes become the most expensive, overtaking those of Hong Kong this year.
Singapore’s private-sector homes have become the most expensive, overtaking those of Hong Kong this year, according to the Washington-based Urban Land Institute (ULI) Asia Pacific Centre’s ULI Asia Pacific 2023 Home Attainability Index, released on Tuesday.
Brands and Business Magazine
The index said that the median price of Singapore’s private-sector homes stood at $1.20 million, compared with Hong Kong’s $1.16 million. In the past year, Singapore’s median private-sector home price increased over 8 per cent, whereas Hong Kong’s median home price decreased 8.7 per cent.
Data compiled by ULI showed also that the median price of a resale Housing and Development Board (HDB) flat rose 7.9 per cent from $379,000 to $409,000 (S$554,000) in 2022. With that, the affordability ratio of HDB resale flats has also crept up from 4.5 to 4.7. Still, including public housing, Singapore housing is ranked “most attainable” in the index.
“Meanwhile, home attainability is severely challenged in Tier 1 and leading Tier 2 cities in mainland China, Hong Kong, Metro Manila, Metro Cebu, Ho Chi Minh City, and Danang with median home prices at approximately 20 to 35 times median household income,” ULI said.
In rentals, Singapore’s private homes chalked up a median monthly rent of $2,596, which is 53 per cent higher than Hong Kong’s median monthly rent of $1,686 and overtaking other high cost-of-living cities like Tokyo ($602) and Seoul ($689). This comes after Singapore’s median monthly rents increased by 29.7 per cent in 2022.
Many reasons
The ULI attributed rising of rental markets to factors such as construction delays, a sudden surge in the number of migrants and a relatively limited stock of institutionally or individually owned rental properties.
The median monthly rent for private homes in Singapore represents 35 per cent of the overall median household income. “However, as most renters of private-sector homes (in Singapore) have higher than median income, the monthly rent amount should be a significantly smaller percentage of the renter’s monthly income,” ULI noted.
Sydney’s single- family homes are the third most expensive with a median price of $980,000, a decrease of nearly 16 per cent since last year. Median home prices in Tokyo Ku (central area) at $627,000 and Seoul at $528,000 also dropped 13 per cent and 14 per cent, respectively.
On a per square metre (sqm) basis, Hong Kong SAR’s private-sector housing is the most expensive at $19,768, well over twice the median figures for the next city cluster consisting of Singapore, Tokyo Ku, and Shenzhen, Beijing, and Shanghai.
Median home prices per sqm for Metro Manila, Cebu, and Ho Chi Minh City are like those in Melbourne and Brisbane as well as some Tier 2 cities in mainland China. In contrast, the cities in India, excluding Mumbai, have the lowest median price per sqm of between $900 and $1,200.
Median home prices for the cities in mainland China were adjusted to reflect the latest available information on home size.
In the 2022 report, which used only median home price per sqm and lacked home size data, median home prices were calculated assuming a median home size of 72 sqm for the mainland Chinese cities. For this year’s report, however, data on median home size was acquired that showed home sizes of mid-50 sqm for Tier 1 cities and larger than 72 sqm for most Tier 2 cities.
Median home prices for the cities in the four developing countries are mainly between $100,000 and $200,000. Among the cities in the developing countries, Ho Chi Minh City has the highest median home price at $296,000, followed by Da Nang at $214,000 and Metro Manila at $181,000.
Home price affordability
The index also noted that Shenzhen continued to have the highest ratio of median home price to median household income at 35. For the remaining Tier 1 cities and leading Tier 2 cities in mainland China, the ratio ranges between 21 and 29. The top two cities in Vietnam, namely Ho Chi Minh City (32.5) and Da Nang (26.7), are among the least affordable in the region. Metro Manila and Cebu’s ratios are 24.8 and 23.3.
Hong Kong’s ratio of median home price to median annual household income is 26.5, considerably lower than last year’s 30.5, due to a sharp price drop.
In Japan, Tokyo Ku has the highest ratio at 17.8, followed by Osaka (13.8) and Yokohama (12.5). The Tokyo suburb of Tachikawa (8.6) and the regional city of Fukuoka (7.2) have significantly better home attainability.
In South Korea, Seoul has the highest ratio at 17.3 while the regional cities’ ratios range between 5.8 and 8.0. The cities in India have ratios of between 6.8 and 11.3, relatively on the low side in the report. Mumbai has the highest ratio at 11.3, closely followed by Bengaluru at 11.1.


